
Figure 3.
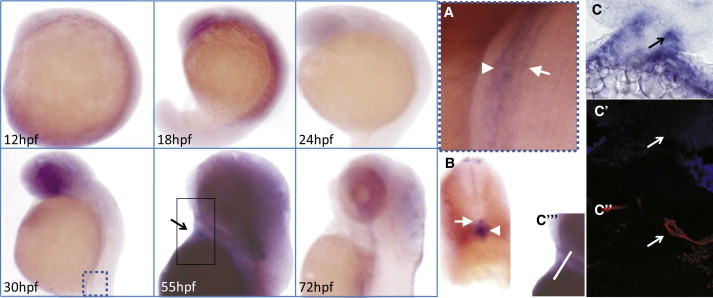
Gene Expression of tab2 in the Developing Zebrafish
mRNA expression of tab2 in the developing zebrafish at distinct developmental stages (indicated in the lower left corner). Boxed parts of embryos at 30 hpf and 55 hpf are repeated in (A) and (C″′), respectively.
(A): Magnification showing expression of tab2 in the dorsal aorta (arrow) and posterior cardinal vein (arrowhead).
(B) Transverse section through the hindbody of a zebrafish at 30 hpf depicted in (A), showing restricted expression in the dorsal aorta (arrowhead) and posterior cardinal vein (arrow).
(C): Bright-field image of the expression of tab2 in the cardiac outflow tract at 55 hpf (arrow).
(C′) DAPI staining of the section depicted in (C) (pseudocolored in blue).
(C″) The section depicted in (C), immunostained with Alexa-647-labeled GFP antibody (pseudocolored in red), displaying the position of the cardiac outflow tract (arrow).
(C″′) Image of a 55 hpf, whole-mount-stained embryo, presenting the orientation of the section shown in (C), (C′), and (C″) (white line).