
Figure 4.
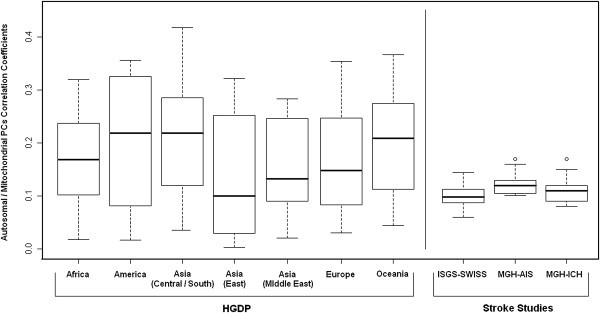
Correlation Coefficients for Autosomal PCs and mtPCs
Correlation between autosomal PCs and mtPCs is visualized as the distribution of correlation coefficients (absolute values) for each population enrolled in the participating studies. HGDP, Human Genome Diversity Panel; MGH-AIS, Massachusetts General Hospital Ischemic Stroke Study; MGH-ICH, Massachusetts General Hospital Intracerebral Hemorrhage Study; ISGS, Ischemic Stroke Genetics Study; SWISS, Siblings With Ischemic Stroke Study