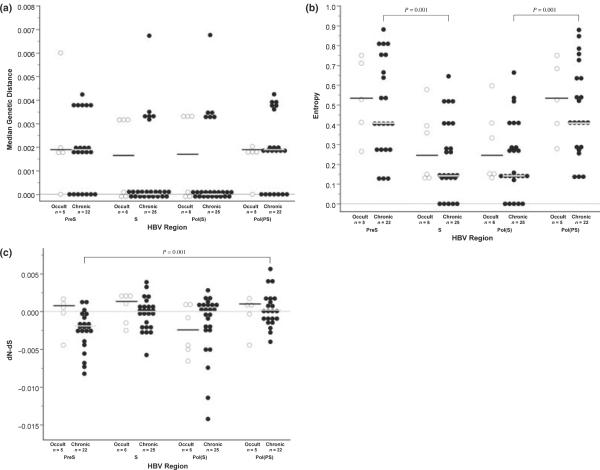
Fig. 2.
Dot plots for (a) median genetic distance, (b) Shannon entropy and (c) nonsynonymous–synonymous calculations. Although sequences were only available for four Occult hepatitis B virus (O-HBV)-infected patients for the PreSurface and Pol(PS) regions, n = 5 because of the mixed infection with genotypes A and G. (◯) represent values for O-HBV infections, while (•) represent values for chronic carriers of the hepatitis B virus (C-HBV) infections. Horizontal bars, black for O-HBV infections and grey for C-HBV infections, represent the median values for each group and dashed lines represent zero.

