Figure 3.
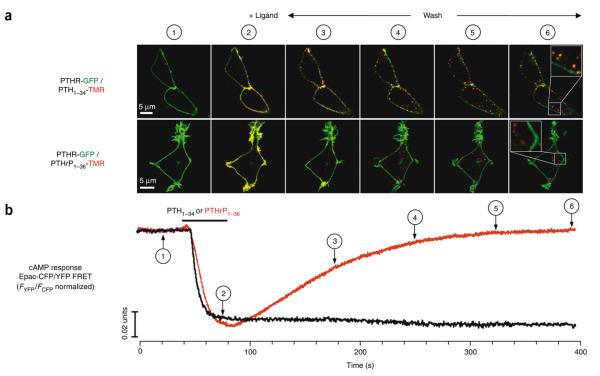
PTHR endocytosis and cAMP responses mediated by PTH1–34 and PTHrP1–36. (a) Trafficking of TMR-labeled ligands and GFP-N-PTHR were monitored in live HEK293 cells by spinning disc confocal microscopy. PTH1–34-TMR or PTHrP1–36-TMR co-localized with GFP-N-PTHR at the time of injection. Fluorescence micrographs in a showed that upon ligand wash, PTH1–34-TMR (red) and GFP-N-PTHR (green) co-localized (yellow) and remained closely associated during receptor internalization (bottom panels). In contrast, PTHrP1–36-TMR alone is detected as small puntae at internalized sites. Pearson's correlation coefficients r ± s.d. (n = 30) are 0.767 ± 0.030 for PTH1−34 and 0.060 ± 0.090 for PTHrP1−36. Individual channel data are shown in Supplementary Figure 6. (b) TMR-labeled or unlabeled ligands (100 nM) were added by perfusion for about 30 s (horizontal bars); numbers 1–6 correlate live cells spinning disc microscopy and FRET time points for cAMP induction as measured by FRET changes in the Epac-CFP/YFP. Cells were HEK293 stably expressing GFP-N-PTHR alone (a) or coexpressing PTHR and Epac-CFP/YFP (b). The recording is representative of n > 10 experiments.

