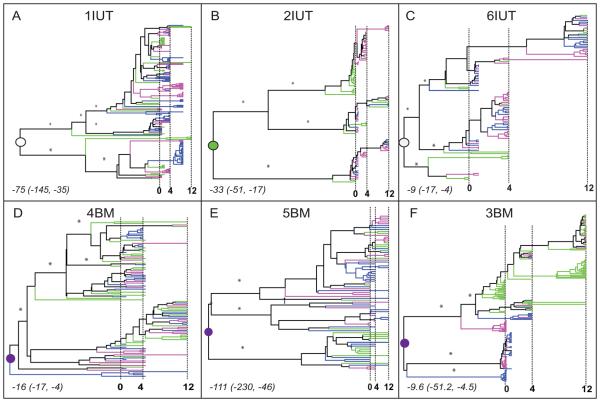
Figure 1. Phylogenetic history of plasma and breast milk virus.
Six patients are designated based on mode of transmission to infants: IUT, in utero; BM, breast milk (panels A-F). A total of 769 non-recombinant sequences (1IUT: 163 sequences; 2IUT: 102; 3BM: 199; 4BM: 102; 5BM: 81; 6IUT: 122) were analyzed. Bayesian maximum clade credibility (MCC) phylogenies were inferred using the GTR+G model of nucleotide substitution, constant population size, and relaxed clock in BEASTv.1.4.7. Branches are scaled in time with the tips of branches sampled from the same date aligned according to the scale in months at the bottom of each panel. Vertical dashed lines indicate 0, 4, and 12 months after delivery. Terminal branches are colored according to the tissue of sampling (green = plasma, pink = right breast milk, blue = left breast milk). Internal branches are colored according to the same scheme when the tissue assignment was unambiguous; otherwise colored black. Asterisks designate posterior branch probabilities >0.7 for major internal branches. Circles indicate the internal node (root node) that is the most recent common ancestor (MRCA) of the entire population. The tissue of origin for the MRCA was determined by parsimony analysis (open = undetermined, green = plasma, purple = breast milk). The time of origin for the MRCA (the median number of months prior to delivery and 95% high posterior density intervals) are noted in italics in the lower left corner for each subject.

