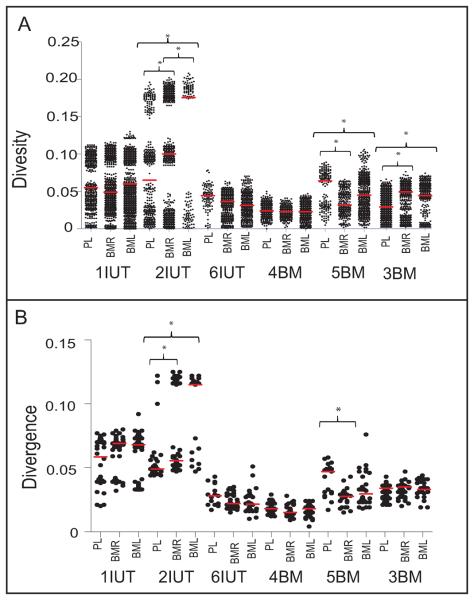
Figure 2. Diversity and divergence of plasma and breast milk virus are similar.
A. Pairwise diversity and B. pairwise divergence from the inferred MRCA for plasma, left and right breast milk samples were calculated in MEGAv4.0 with the maximum likelihood + G correction. The median for each group of sequences is indicated with a horizontal red line. The y-axis is scaled in substitutions/site, defined as the number of nucleotide differences between two sequences divided by the sequence length. Asterisks indicate significantly different medians between tissues in the same patient (p<0.0019).

