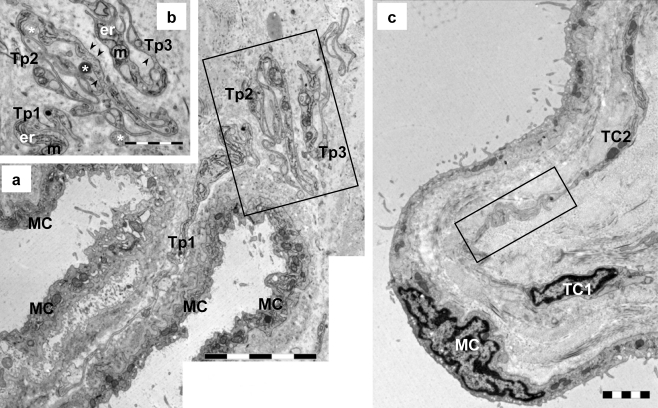
Fig. 1.
Transmission electron microscopy (TEM) images of two serial sections of mouse parietal pleura to illustrate the long telopodes (Tp) and their sinuous trajectory. a Tp (Tp1: 20 μm; Tp2: 24 μm; Tp3: 20 μm) have a convoluted contour suggesting their capacity to compensate for changes in length attributable to pleural expansion (MC mesothelial cells). b TEM image of the adjacent section showing details of the Tp from the boxed area in a. Tp have thin segments (podomeres) alternating with dilatations (podoms), which accommodate mitochondria (m), endoplasmic reticulum (er), and caveolae (arrowheads). Note the shed vesicles (asterisks) in close proximity to Tp. c TEM image of the telocyte network (TC1: 14 μm long, TC2: 15 μm long) beneath the mesothelial cell layer (MC). The boxed area was selected for electron tomography (see Fig. 5). Bars 5 μm (a), 2 μm (b, c)

