Fig. 6.
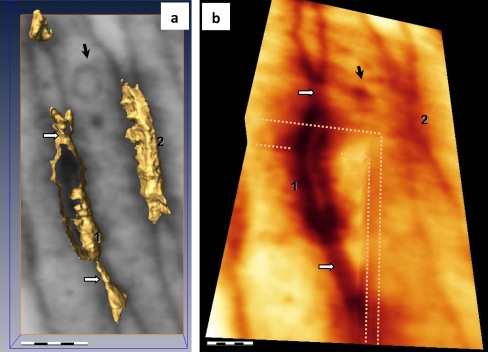
Details of ET in TC junctional complex in mouse parietal pleura (black arrow vesicle visible in one telopode involved in the junctional complex). a Top view of the 3D isosurface reconstruction of junctions 1 and 2 from Fig. 5d shows an intercellular cleft (about 20 nm wide) between tight connecting lines (white arrows). b Cropped corner of the reconstructed volume showing the tight peripheral connecting lines (white arrows) in different planes. Bars 0.5 μm (a), 0.2 μm (b). See also the ET 3D volume in Fig. S2

