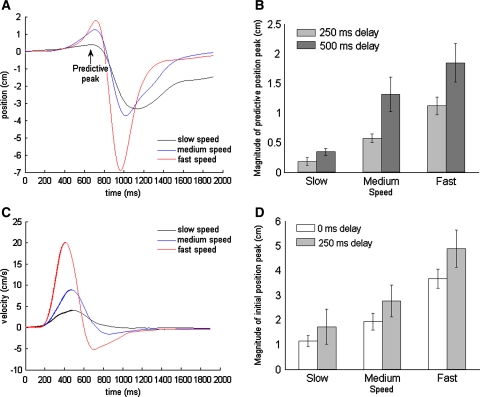
Fig. 2.
Evidence against time-dependent control. a Position data for the OH averaged over all subjects for the first trial at the slow (black), medium (blue) and fast (red) speeds in the 500 ms delay condition. As the speed increases, the magnitude of the predictive peak also increases, but the onset time is not affected. b Average predictive position peak magnitude (and standard error) in the 250 and 500 ms delay conditions for all three movement speeds. c Velocity data for the OH averaged over all catch trials and all subjects in the pilot experiment at the slow (black), medium (blue) and fast (red) speeds in the 250 ms delay condition. Again, the onset time is not affected by the increase in speed. The bold lines up to maximum velocity show that the traces are scaled versions of each other before corrective movements are made (from maximum velocity onwards; fine lines). d Average predictive position peak magnitude (and standard error) in the 0 and 250 ms delay conditions for all three movement speeds in the catch trials of the pilot experiment

