
Figure 8.
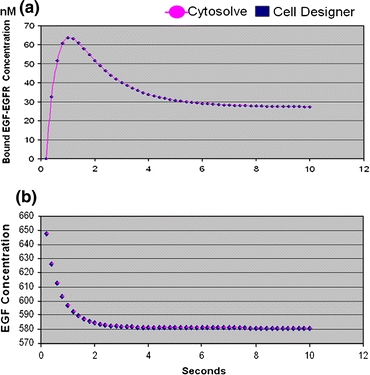
Comparison of results from CytoSolve and Cell Designer for two species. (a) Compares values of the EGF-EGFR species. (b) Compares values of EGF concentration
Official websites use .gov
A
.gov website belongs to an official
government organization in the United States.
Secure .gov websites use HTTPS
A lock (
) or https:// means you've safely
connected to the .gov website. Share sensitive
information only on official, secure websites.
Comparison of results from CytoSolve and Cell Designer for two species. (a) Compares values of the EGF-EGFR species. (b) Compares values of EGF concentration