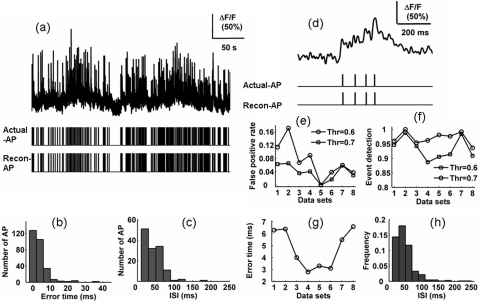
Figure 2.
Capability of MSF_TC algorithm in AP train reconstruction: (a) calcium fluorescence transients (top), the corresponding real (Middle) and reconstructed (bottom) AP trains; (b) histogram of the difference between AP firing reconstruction and real timing obtained by analyzing data set in (a); (c) ISI distribution from the actual AP train [middle panel in (a)]; and (d) burst AP firing corresponding calcium fluorescence, real and reconstructed AP train. For an eight-data-set analysis, a 10% change of the threshold influenced by (e) the false positive rate and (f) the event detection. (g) plot of the standard deviation of the absolute error between real and reconstructed AP timings and (h) ISI distribution for eight real AP trains.

