
FIG. 1.
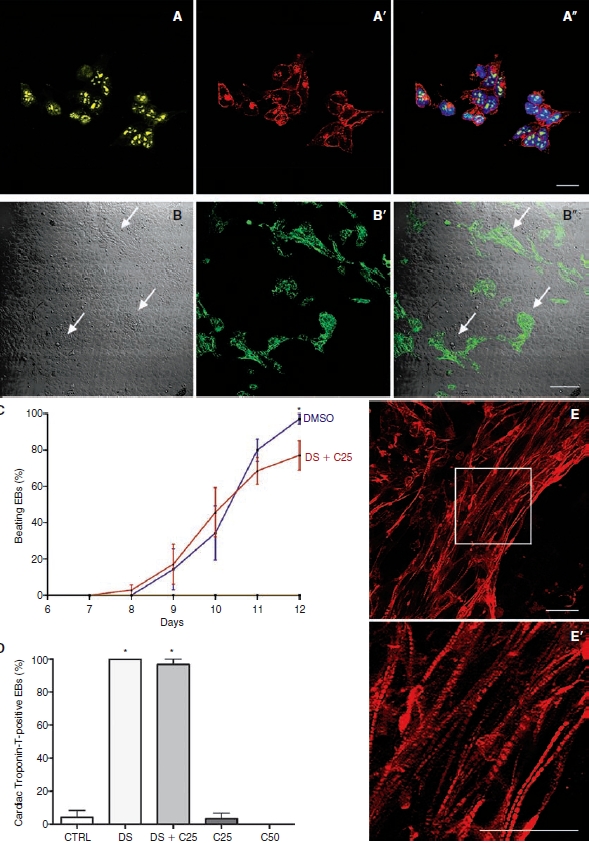
Characterization of undifferentiated and differentiated P19 cells. (A–A″) Pluripotency marker expression in undifferentiated P19 cells. (A) Oct-4. (A′) SSEA-1. (A″) Nuclear counterstaining with DAPI (blue) in the merged image. (B–B″) Beating clusters stained for troponin-I. (B) Phase contrast microscopy of beating areas (arrows). (B′) Immunofluorescence for troponin-I. (B″) Merged image (arrows showing beating cells stained with troponin-I). (C) Time course of beating embryoid body (EB) appearance after DMSO and DS+C25 treatment in cultures of P19 cells. CTRL, C25, C50, and C375 groups did not show beating clusters (N = 7). (D) Quantification of cardiac troponin-T expression in EBs at 12 days of differentiation (N = 6). (E–E′) Confocal Z-sections projected images showing cardiac troponin-T in differentiated P19 cells from the DS group. (E) Cardiac troponin-T expression. (E′) Higher magnification confocal microscopy image of the area indicated by the inset in (E) illustrating morphology and cardiac troponin-T expression pattern. Scale bars: A and E = 20 μm; B = 100 μm. Error bars represent SEM. *P < 0.05.