
FIG. 5.
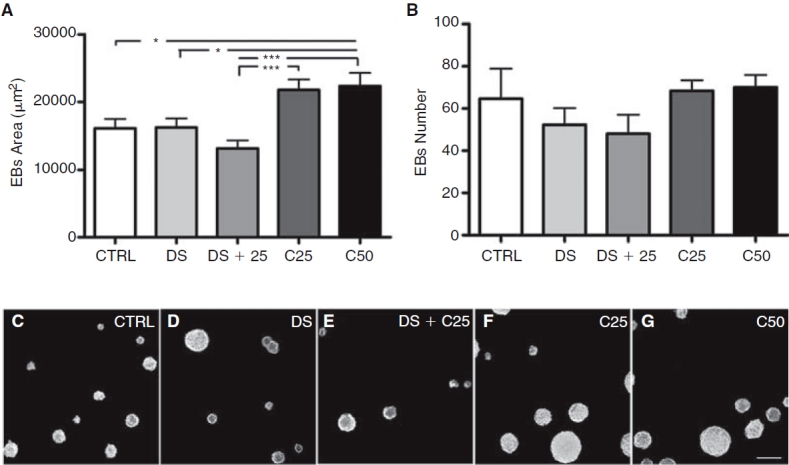
Quantitative analysis of embryoid body (EB) numbers and areas after 4 days of treatment in non-adherent dishes. (A) Measure of EB areas (N = 116). (B) Measure of EB numbers (N = 3). (C–G) Representative images showing EB numbers and areas for the different groups. (C) Control. (D) 1% DMSO. (E) 1% DMSO plus 0.25 μM cardiogenol C. (F) 0.25 μM cardiogenol C. (G) 0.50 μM cardiogenol C, scale bar = 200 μm. Error bars represent SEM, *P < 0.05 and ***P < 0.001.