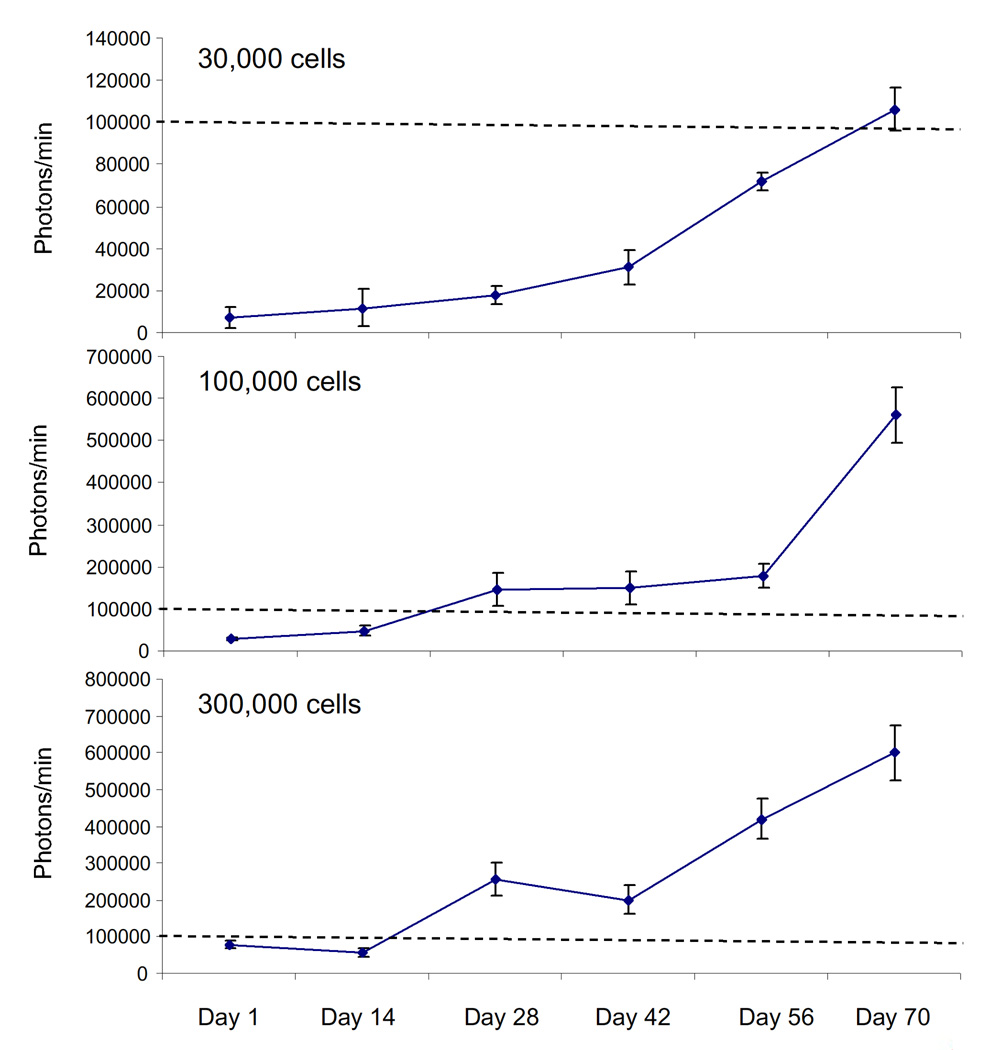
Figure 2. Quantification of bioluminescent signals.
Tumor growth in Figure 1A was monitored by in vivo bioluminescence imaging using a CCD camera and RSI IDL 6.3 program was used for the quantification of photo counts. Relative luciferase activity is shown as the mean photons/minute ± S.D. Dashed lines indicate 100,000 photons/minute (note: ordinate scale differs in 3 panels).

