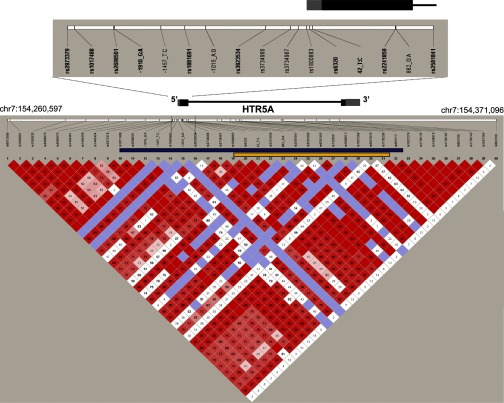
Fig. 1.
The HTR5A gene and linkage disequilibrium structure. The 40 single nucleotide polymorphisms (SNPs) cover the chromosomal interval chr7:154,260,597–154,371,096. The color diagram depicts the pair-wise linkage disequilibrium between SNPs (D′), as calculated for the family-based cohort of 1,560 individuals using the program Haploview version 4.1. The gene structure of HTR5A is depicted in bar and line format. Gray bars represent the untranslated mRNA sequences. A close-up view of the region resequenced in our study is shown with the exon 1 in location relative to the positions of the SNPs in this region. Haplotype blocks analyzed for their contribution to the observed linkage are highlighted by bars. A haplotype of contiguous SNPs depicted by the blue bar covers the region from 2,303 bp upstream to 17,628 bp downstream of the HTR5A gene and explains 26% of the observed linkage. In contrast, a haplotype for a smaller region, depicted by the yellow bar, which spans 19 bp upstream to 13,170 bp downstream of HTR5A, reduces the logarithm of the odds (LOD) score by only 5%. This analysis reveals a critical region between rs1017488 and rs1800883 likely to contain causal variants that contribute significantly to the observed linkage.

