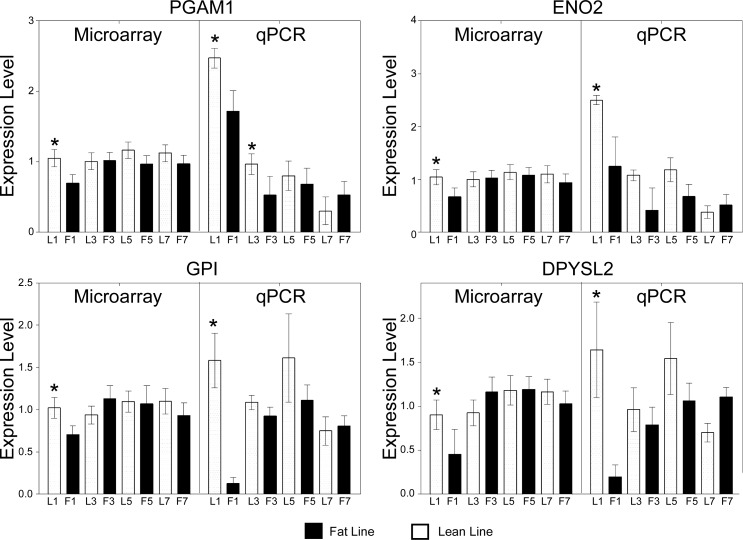
Fig. 5.
Expression pattern verification for genes involved in glycolysis. Data expression patterns were similar for microarray (left) and qRT-PCR (right). The log scale microarray data have been converted, which compresses the data points around the value of 1. Values reported are means ± SE. *Differential expression between the lines at the same age (P < 0.05). Gene symbols are defined in the text.

