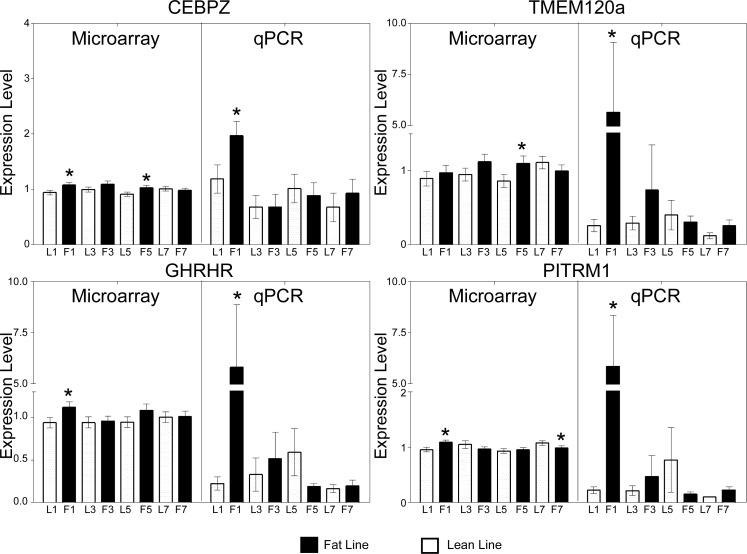
Fig. 6.
Expression pattern verification for genes identified by comparison of significant genes. Expression patterns for FL relative to LL at 1 wk of age were increased for genes presented in our model. The log scale microarray data have been converted, which compresses the data points around the value of 1. Values reported are means ± SE. *Differential expression between the lines at the same age (P < 0.05). Gene symbols are defined in the text.

