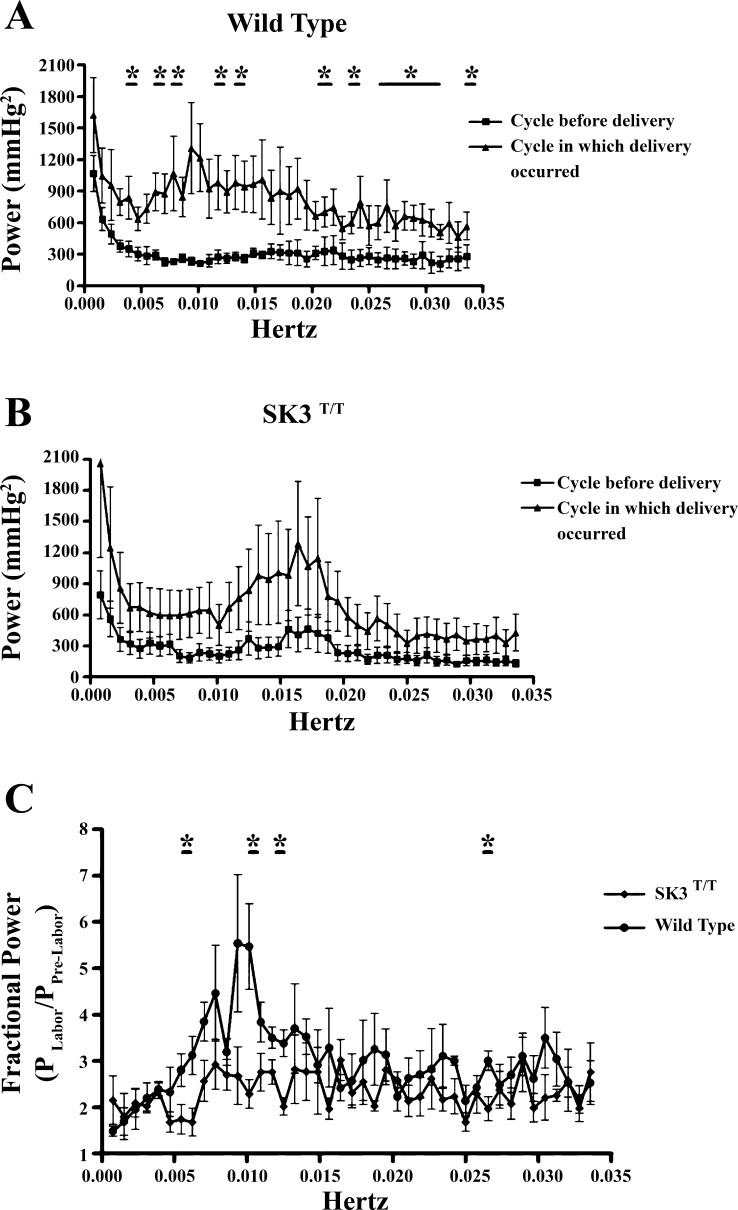
Fig. 8.
Power spectrum of intrauterine pressure during the 12-h cycle before delivery and the 12-h cycle in which delivery occurred. A: the power spectrum of WT baseline intrauterine pressure produced in the 12-h cycle during delivery increased above the baseline frequency measured during the 12-h cycle before delivery. Values are means ± SE (n = 4). *P < 0.05 for cycle before delivery vs. cycle in which delivery occurred. B: the power spectrum generated from SK3T/T intrauterine pressure during the 12-h cycle in which delivery occurred was not significantly elevated above that for the 12-h cycle before delivery. C: comparison of the normalized power spectra of WT and SK3T/T intrauterine pressure during the 12-h cycle in which delivery occurred, demonstrating that at certain frequencies more power was produced during WT delivery. Values are means ± SE (n = 4 for both WT and SK3T/T). *P < 0.05 vs. WT-cycle in which delivery occurred.

