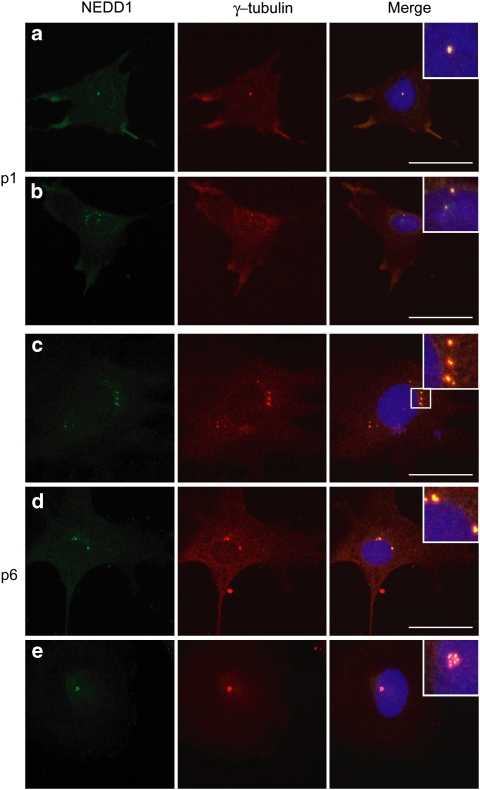
Figure 2.
Abnormal centrosome numbers in senescent MEFs. MEFs were stained for NEDD1 (green), γ-tubulin (red) and Hoechst 33342 (blue), at each passage until senescence. The centrosomes are enlarged in the insets. Where not obvious, the area enlarged is shown by a smaller box. (a and b) At passage 1 (p1), most cells display normal numbers of centrosomes with either one (panel a) or 2 (panel b) centrosomes costaining with NEDD1 and γ-tubulin. (c–e) By passage 6 (p6), many cells display more than two centrosomal structures either distributed throughout the cell (panels c and d) or in close proximity to each other (panel e). Scale bars=20 μm

