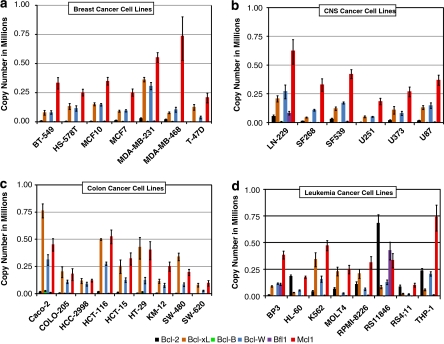
Figure 2.
Expression of the six antiapoptotic Bcl-2 subfamily members in the breast, CNS, colon, and leukemia cancer cell lines. (a–d) Bar graphs representing the relative copy number of each Bcl-2 subfamily member: Bcl-2 in black, Bcl-xL in orange, Bcl-B in green, Bcl-W in blue, Bfl1 in purple, and Mcl1 in red. Cell lines are grouped according to their identified tissue type. Error bars represent S.E.M.

