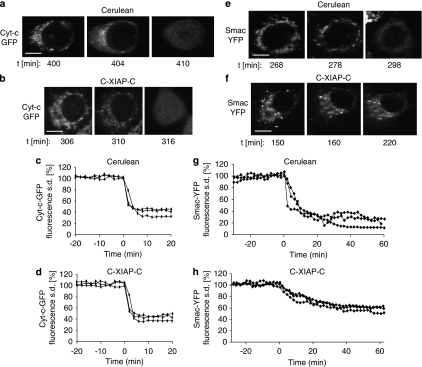
Figure 3.
Cyt-c-GFP and Smac-YFP release in the presence of C-XIAP-C expression. (a, b) A Cerulean-expressing or a C-XIAP-C-expressing MCF-7 cell releasing cyt-c-GFP in response to 100 ng/ml TRAIL plus 1 μg/ml CHX is shown. Upon release, cyt-c-GFP fluorescence redistributed from the mitochondria into the cytosol. Time indicates minutes after stimulus addition. Scale bar=10 μm. (c, d) Temporal profiles of cyt-c-GFP release in Cerulean-expressing (c) or C-XIAP-C-expressing (d) MCF-7 cells. The cyt-c-GFP release process was plotted as the change in cellular fluorescence S.D. and shown for three representative cells. Release onset was set to time zero. Cyt-c-GFP release proceeded rapidly. A total of n=10 Cerulean-expressing cells or n=19 C-XIAP-C-expressing cells from 4 or 6 experiments were analysed, respectively. (e) A Cerulean-expressing MCF-7 cell releasing Smac-YFP in response to 100 ng/ml TRAIL plus 1 μg/ml CHX is shown. Upon release, Smac-YFP fluorescence redistributed from the mitochondria to the cytosol. Time indicates minutes after stimulus addition. Scale bar=10 μm. (f) A C-XIAP-C-expressing MCF-7 cell releasing Smac-YFP in response to 100 ng/ml TRAIL plus 1 μg/ml CHX is shown. Smac-YFP fluorescence redistribution from the mitochondria to the cytosol seemed incomplete even after prolonged times. Time indicates minutes after stimulus addition. Scale bar=10 μm. (g, h) Temporal profiles of Smac-YFP release in Cerulean-expressing (g) or C-XIAP-C-expressing (h) MCF-7 cells. The Smac-YFP release process was plotted as the change in cellular fluorescence S.D. and shown for three representative cells. Release onset was set to time zero. Smac-YFP release in C-XIAP-C-expressing cells was slow and the loss in fluorescence S.D. was less pronounced when compared with Cerulean-expressing cells. A total of n=13 Cerulean-expressing cells or n=17 C-XIAP-C-expressing cells from 6 or 8 experiments were analysed, respectively

