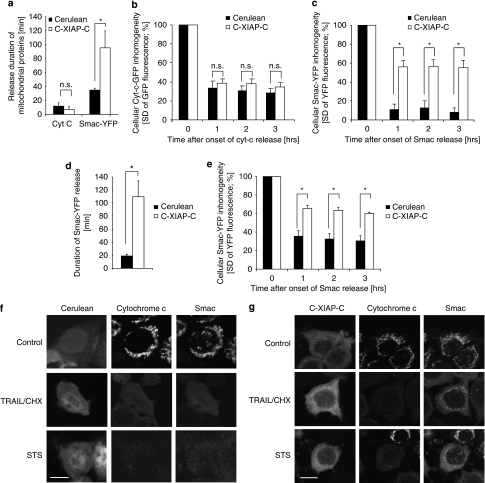
Figure 4.
Elevated XIAP expression results in significantly prolonged and submaximal release of Smac. (a) The duration of cyt-c-GFP or Smac-YFP release in response to 100 ng/ml TRAIL/1 μg/ml CHX was quantified for all MCF-7 cells measured and statistically compared. Cyt-c-GFP release durations were from 10 and 19 cells expressing Cerulean or C-XIAP-C, respectively. Smac-YFP release durations were from 13 and 17 cells expressing Cerulean or C-XIAP-C, respectively. Error bars represent S.E.M. *P<0.05; NS, not significant (Student's t-tests). (b) Comparison of amounts of cyt-c-GFP released in response to 100 ng/ml TRAIL/1 μg/ml CHX in cells expressing Cerulean or C-XIAP-C. Cellular fluorescence S.D. for 10 and 19 cells per group were compared at 1, 2 and 3 h after onset of cyt-c-GFP release. No significant difference could be detected between Cerulean- or C-XIAP-C-expressing MCF-7 cells. Error bars represent S.E.M. NS, not significant (Student's t-tests). (c) Comparison of amounts of Smac-YFP released in response to 100 ng/ml TRAIL/1 μg/ml CHX in cells expressing Cerulean or C-XIAP-C. Cellular fluorescence S.D. for 13 and 17 cells per group were compared at 1, 2 and 3 h after onset of Smac-YFP release. Significantly less Smac-YFP was released in MCF-7 cells expressing C-XIAP-C. Error bars represent S.E.M. *P<0.05, Student's t-tests. (d) As in (a), release durations of Smac-YFP were compared in MCF-7 cells exposed to 1 μM STS (n=8 or 11 cells per group). Smac release was significantly prolonged in cells expressing C-XIAP-C. Error bars represent S.E.M. *P<0.05, Student's t-test. (e) Comparison of amounts of Smac-YFP released in response to 1 μM STS in cells expressing Cerulean or C-XIAP-C. Cellular fluorescence S.D. for 8 and 11 cells per group were compared at 1, 2 and 3 h after onset of Smac-YFP release. Significantly less Smac-YFP was released in MCF-7 cells expressing C-XIAP-C. Error bars represent S.E.M. *P<0.05, Student's t-tests. (f, g) Immunofluorescence scans of native cyt-c and Smac in Cerulean-expressing (f) or C-XIAP-C-expressing (g) MCF-7 cells. Cells expressing Cerulean co-released both cyt-c and Smac (f). In C-XIAP-C-expressing cells, Smac was partially retained in the mitochondria, whereas cyt-c was apparently fully released in response to both TRAIL/CHX and STS (g). Scale bars=10 μm

