Figure 5.
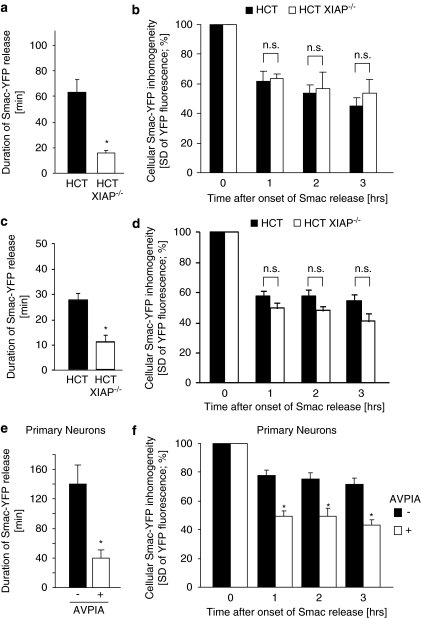
Physiological XIAP expression can impair Smac release. (a) The duration of Smac-YFP release in response to 100 ng/ml TRAIL/1 μg/ml CHX was quantified for parental and XIAP-deficient HCT-116 cells. Data are means from n=10 and 7 cells per group. Error bars represent S.E.M. *Significant acceleration of Smac release (P<0.05; Student's t-test). (b) Comparison of amounts of Smac-YFP released in response to 100 ng/ml TRAIL/1 μg/ml CHX. Cellular fluorescence S.D. for 10 and 7 cells per group were compared at 1, 2 and 3 h after onset of Smac release. Data are shown as means; error bars represent S.E.M. NS, not significant (Student's t-test). (c) The duration of Smac-YFP release in response to 1 μM STS was quantified for parental and XIAP-deficient HCT-116 cells. Data are means from n=8 and 5 cells per group. Error bars represent S.E.M. *Significant acceleration of Smac release (P<0.05; Student's t-test). (d) Comparison of amounts of Smac-YFP released in response to 1 μM STS. Cellular fluorescence S.D. for 8 and 5 cells per group were compared at 1, 2 and 3 h after onset of Smac release. Data are shown as means; error bars represent S.E.M. NS, not significant (Student's t-test). (e) The duration of Smac-YFP release in mouse cortical neurons in response to 300 nM STS was quantified either in the presence or absence of an IAP-antagonizing peptide. Data are means from n=10 and 12 cells per group. Error bars represent S.E.M. *Significant acceleration of Smac release (P<0.05; Student's t-test). (f) Comparison of amounts of Smac-YFP released in mouse cortical neurons. Cellular fluorescence S.D. for 10 and 12 cells per group were compared at 1, 2 and 3 h after onset of Smac release. Data are shown as means, error bars represent S.E.M. *Significant differences in Smac release (P<0.05; Student's t-test)

