Figure 3.
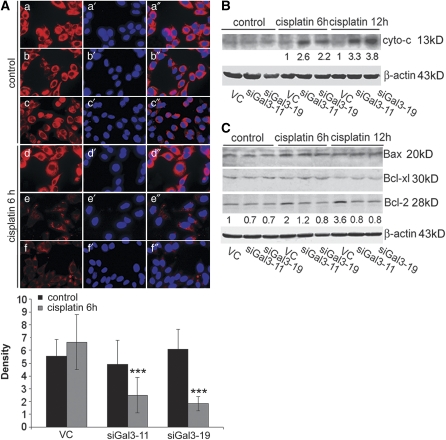
Gal-3 knockdown enhanced cisplatin-induced mitochondrial apoptotic events. Cells were treated with 50 μM cisplatin for indicated times. (A) Fluorescent image of mitochondria staining (400 × magnification). Mitochondria were stained as indicated in Materials and Methods. a–f, mitochondria staining with MitoTracker Red CMXRos; a′–f′, nuclear staining with 4′, 6-diamidino-2-phenylindole; a″–f″, merged image. a–a″ and d–d″, VC; b–b″ and e–e″, siGal3-11; c–c″ and f–f″, siGal3-19. Lower panel is the quantification of fluorescent density of mitochondria staining using Adobe Photoshop CS3 extended software (Adobe Systems Incorporated, San Jose, CA, USA). ***P<0.001, compared with VC cells. Western blot analysis of cytochrome c release (B) and Bcl-2 family members (C). Numbers represent the relative intensities of cytochrome c and Bcl-2 normalized to β-actin. The values for cytochrome c and Bcl-2 of VC cells were set as “1”. Data are representative of three independent experiments

