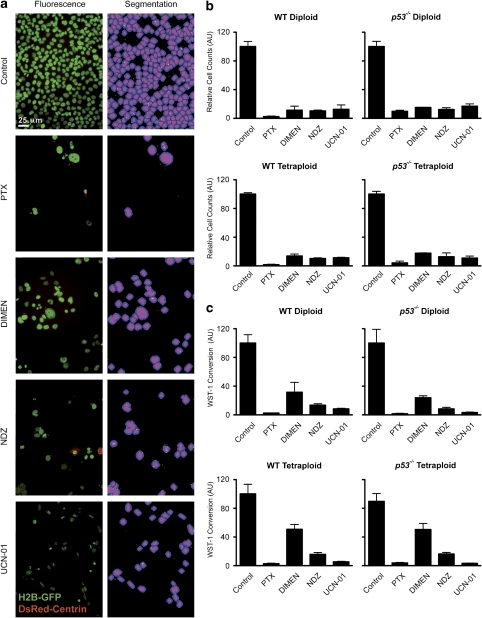
Figure 2.
Automated image analysis for the detection of cell death. (a) Fluorescence microphotographs of wild-type (WT) diploid HCT 116 cells co-expressing biosensors for the detection of chromatin status and centrosome number (H2B-GFP and DsRed-Centrin, respectively) – either left untreated (Control) or incubated for 72 h with paclitaxel (PTX), dimethylenastron (DIMEN), nocodazole (NDZ) or 7-hydroxystaurosporine (UCN-01) – were processed for the creation of the following segmentation masks: nuclei (pink), cells=nuclei+10 pixels (pink+blue); centrosomes (white or green, depending whether they are superposed or not to other regions of interest (ROIs)) (scale bar=10 μm). (b) Automated cell counting within microphotographs allowed for an indirect assessment of cell survival (untreated cultures were used as a control for the relative estimation of cell number). (c) The indirect quantification of cell survival by colorimetric assays based on the conversion of the tetrazolium salt WST-1 provided similar results. The fraction of surviving cells (WST-1 conversion normalized to the mean of control conditions) is depicted (mean±S.E.M., n=3 independent experiments). AU, arbitrary unit; DsRed, Discosoma striata red fluorescent protein; GFP, green fluorescent protein; H2B, histone H2B

