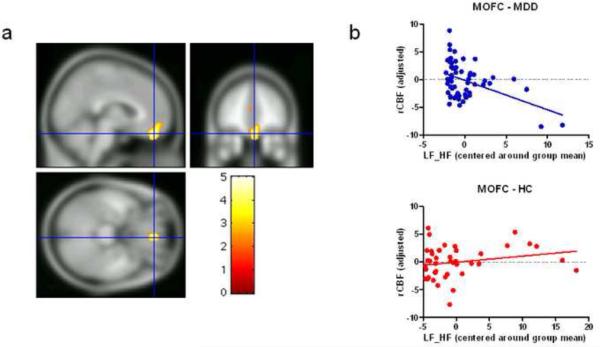
Figure 2.
a) Illustration of the cluster within medial orbitofrontal cortex (MOFC) in which the correlation between rCBF and LF/HF differed significantly between subjects with MDD and healthy controls. The t-value image was thresholded at the voxel p-value of p<0.01 uncorrected, with a cluster extent 300 voxels b) The rCBF, adjusted for regressors of no interest, plotted versus the mean centered LF/HF for the voxel within the MOFC cluster shown in a) with the peak t-value (x=4, y=44, z=−22).

