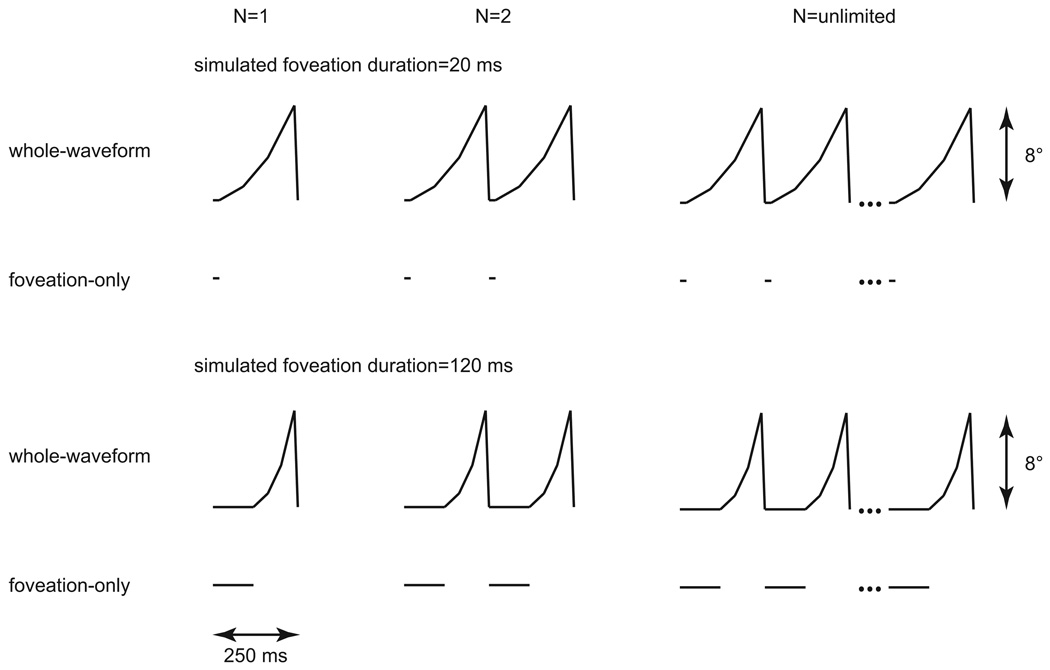
Figure 1.
Idealized position traces showing the accelerating ramp waveforms used to simulate the retinal image motion in jerk nystagmus for the whole-waveform condition with simulated foveation durations of 20 and 120 ms. Each waveform has a frequency of 4 Hz and an amplitude of 8°. For comparison, traces for the foveation-only condition are shown underneath. Three different numbers of cycles of stimulus presentation are illustrated: one (N=1), two (N=2) and unlimited.

