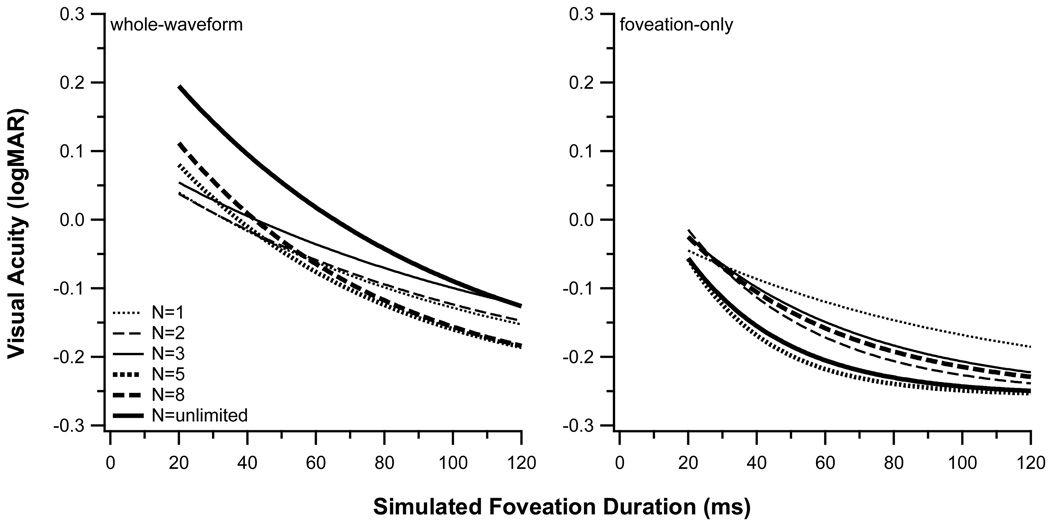
Figure 3.
Visual acuity (logMAR) is plotted as a function of simulated foveation durations (ms) for (left) the whole-waveform and (right) the foveation-only condition. In each panel, the different curves represent the acuity vs. duration functions fit to the data for different number of cycles of stimulus presentation. These curves are the same as those shown in Fig. 2.

