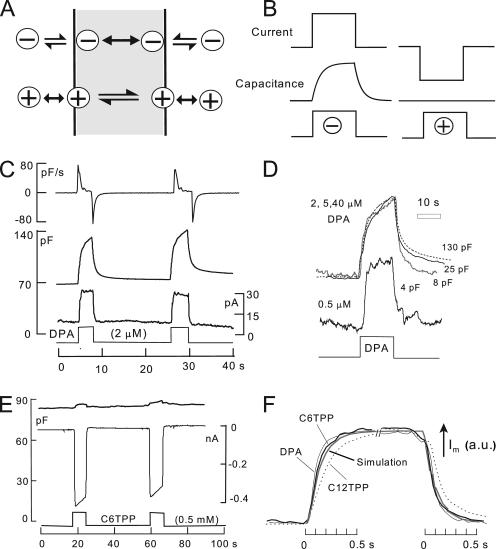
Figure 1.
The function of hydrophobic anions and cations. (A) Hydrophobic anions translocate reversibly through the hydrophobic core of the membrane much faster than they dissociate from the membrane. Hydrophobic cations translocate slowly across the membrane in relation to their dissociation rates from the membrane. A positive dipole potential within the membrane is assumed to promote anion binding over cation binding by several hundredfold. (B) Predictions of simple models of hydrophobic ion function. When applied rapidly to membranes, hydrophobic anions give rise to a capacitive signal that develops with the time course of their binding/dissociation from the membrane. The net current generated by their passage through the membrane field (“flux”) develops immediately. In contrast, hydrophobic cations do not generate a capacitive signal. (C) DPA-capacitive signals and currents in BHK cells using standard solutions with 2 mM ATP and 0.2 mM GTP on the cytoplasmic side. Rapid application and removal of 2 µM DPA causes an immediate outward current and a slowly rising capacitive signal, which decays toward an increased baseline upon DPA removal. The major time constant of the rising and falling signals is 0.35 s. The DSF, i.e., the ratio of minimum diffusional flux to current, is 1.8. (D) DPA-capacitive signals upon applying and removing different DPA concentrations in the same BHK cell. The signals are scaled to allow comparison of the wave forms. With low DPA concentrations, capacitive signals come to a steady state more rapidly than with high concentrations (>2 µM), and slowly decaying signal components become more pronounced with high DPA concentrations. (E) Currents and capacitance records for the application and removal of the hydrophobic cation, C6TPP (0.5 mM). Capacitance changes are negligible in relation to those evoked by DPA. (F) Normalized current records showing the time courses of current activation and deactivation upon applying and removing 2 µM DPA, 0.5 mM C6TPP, and 25 µM C12TPP. The gray curve shows the expected time course for diffusion through a 10-µm solution layer, with a diffusion coefficient of 0.5 × 10⁻⁵ cm2/s.

