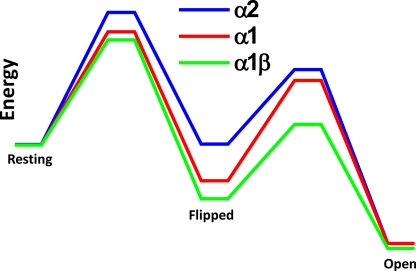
Figure 7.
Energy diagram for the resting–flipped–open transitions for the fully liganded α1, α1β, and α2 GlyR. Calculations used a frequency factor of 10−7 s−1 (Andersen, 1999) and the results of the fit of Scheme 2 (flip with two binding sites and one open state) for α2 GlyR, and data from Burzomato et al. (2004) for the α1-containing GlyRs.

