Figure 5.
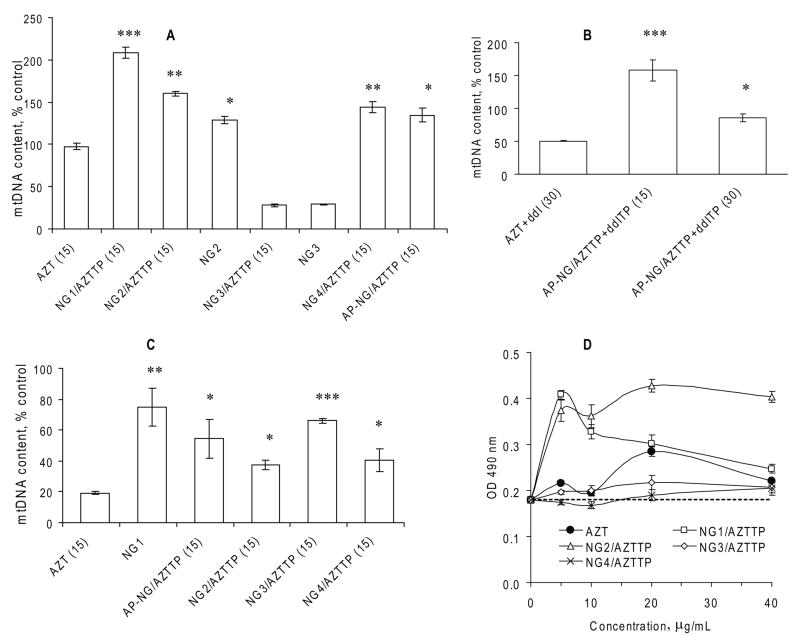
Mitochondrial toxicity of Nano-NRTIs in MDMs and HepG2 cells. (A) Mitochondrial (mt) DNA content in MDMs treated with three doses of corresponding Nano-AZTTPs (at AZT concentration of 15 μg/mL) or nanogels without drugs for 14 days at 37°C. qPCR data for mtDNA were normalized by a reference gene data and presented as percentage of the mtDNA level in non-treated MDMs taken for 100% (means ± SEM, n = 5); (*) P < 0.001, (**) P < 0.01, and (*) P < 0.05 between AZT group and Nano-NRTIs or nanogels. (B) mtDNA content in MDMs treated with AZT+ddI (1:1 w/w) mixture and corresponding AP-NG/AZTTP+ddITP formulations at two doses 15 and 30 μg/mL, as described above (means ± SEM, n = 5); (*) P < 0.001, and (*) P < 0.05 between AZT+ddI group and Nano-NRTIs. (C) mtDNA content in HepG2 cells treated as described above (means ± SEM, n = 5); (*) P < 0.001, (**) P < 0.01, and (*) P < 0.05 between AZT group and Nano-NRTIs or nanogels. (D) Absorbance of the formazan product (OD 490 nm) observed in a MTT cytotoxicity assay of HIV-infected MDMs treated with AZT or Nano-AZTTPs (means ± SEM, n = 5). Absorbance level for non-treated HIV-infected cells is shown by the dotted line.

