
Figure 6.
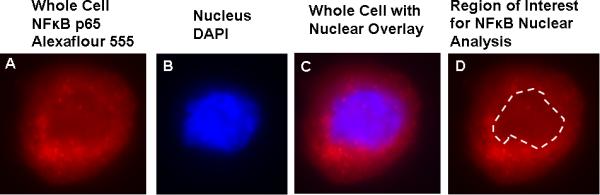
Measurement of endothelial cell (EC) nuclear protein expression. A: Representative EC immunostained for the p65 subunit of the nuclear transcription factor NFκB and visualized by fluorescent microscopy. B: Nucleus of the same cell is visualized by DAPI nuclear stain. C: Overlay of nuclear stain with that of total EC NFκB p65. The border of the nucleus is outlined using this overlay image. D: Fluorescent intensity of the cell within the border of the nucleus is measured to determine nuclear NFκB p65 protein expression.