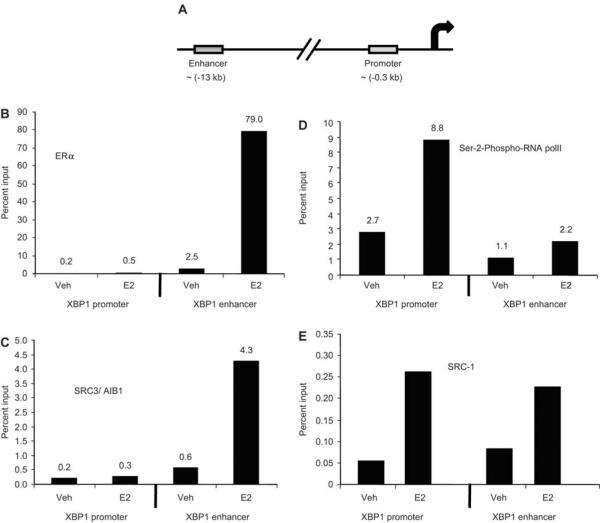
Figure 3.
Recruitment of ERα, phospho-serine-2-RNA polII, SRC-1 and SRC-3, at the proximal promoter and distal enhancer region of the XBP1 gene assessed by chromatin immunoprecipitation (ChIP) assay. MCF7 cells were treated with vehicle or E2 (1 nM) for 45 min and ChIP assay was performed as mentioned in the materials and methods section. Schematic representation of the promoter and enhancer regions of the XBP1 gene (A). The extent of recruitment of the factors indicated is shown for promoter and enhancer region of the XBP1 gene. The data are expressed as percent input of 1/20th part of starting chromatin material in each case after subtracting non-specific binding. The data shown are representative of three separate experiments with similar results.

