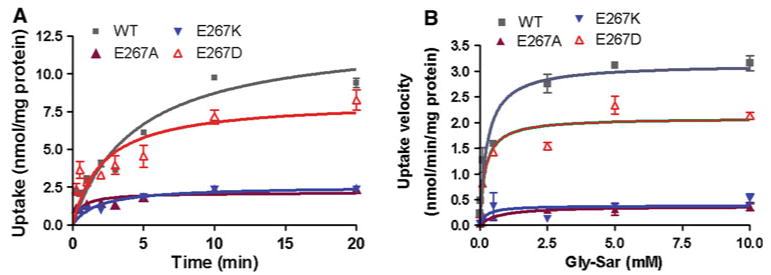
Fig. 5.

a Time courses of Gly-Sar uptake by WT-hPEPT1 (gray) and E267D (red), E267A (purple) and E267K (blue) mutants (n ≥ 3 for each point). b Concentration dependence of Gly-Sar uptake by WT-hPEPT1 and E267 mutants in transiently transfected HEK293 cells. Initial uptake rates were determined by linear regression analysis of the linear portion of the plot of Gly-Sar uptake vs. time (Color figure online)
