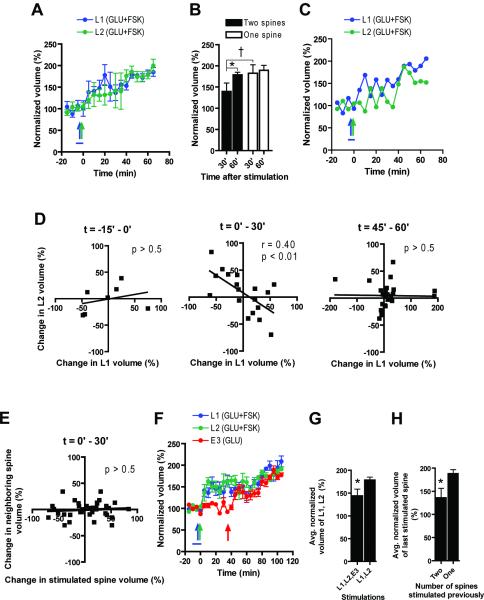
Figure 5. Competition between spines.
A) Pooled data from 7 experiments show that stimulating two spines (10μm–20μm apart; L1, L2; GLU+FSK stimulation) 1min apart resulted in slower growth of both spines compared to stimulating one spine (GLU+FSK stimulation). B) Spine growth was compared between two cases when either a single spine was stimulated (Fig. 1B and Fig. S1A) or two spines 10μm–20μm apart were stimulated successively. C) Representative experiment, showing complementary growth and shrinkage during the first 30min but not after 35min post-stimulation. D) Correlation of the change in spine volume at L1 with the change in spine volume at L2 at each 5min interval shows that L1 and L2 grew independently prior to stimulation, and after 35min post-stimulation. However, within the first 30min after stimulation, one spine grew at the expense of the other. Each time point on the graph represents the difference in volume between two successive time points using spines from 6 independent experiments. E) In contrast to D, there was no correlation between stimulated spines and their neighbors during the 0–30min period indicating that the competition was specific to stimulated spines. F) Pooled data from 6 experiments show that a third spine stimulated with GLU stimulation (E3) could compete for growth with spines given GLU+FSK stimulation earlier (L1, L2). G) Stimulation of E3 slowed growth of L1, L2, quantified by comparing the average growth of L1 and L2 30min after E3 is stimulated with the average growth of L1 and L2 in the absence of E3 stimulation (from Fig. 3D). H) Stimulating two spines with GLU+FSK stimulation prior to later GLU stimulation (E3 after L1, L2) reduced the efficiency of the later stimulation, as compared to stimulating only one spine prior to the later stimulation (E2 after only L1 from Fig. 2L). Blue, teal and red arrows represent uncaging tetani. Blue bar represents forskolin. *: p < 0.01 between adjacent bar. †: p < 0.05 in Figure 5B in comparison between 1 and 2 spines for the 30' time point. GLU: tetanus of glutamate uncaging, FSK: forskolin (bath applied). Normalization performed as percent of average baseline value for each spine. All data mean +/− SEM.

