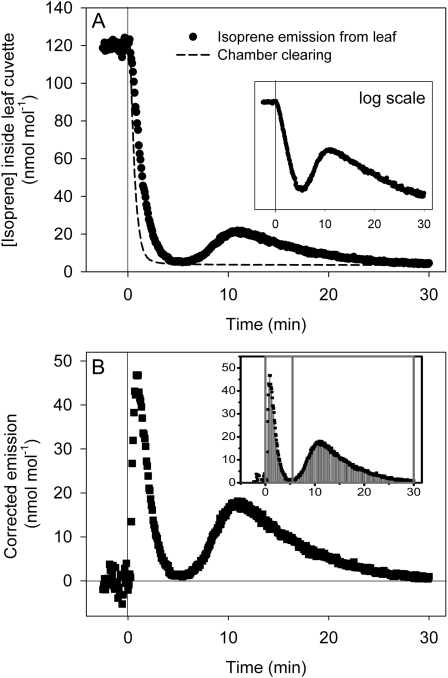
Figure 1.
A typical postillumination isoprene emission trace in oak leaf under standard conditions. A, Light was turned off at time 0. After emission dropped to almost zero in approximately 5 min, isoprene emission increased again and then fell slowly in 20 to 30 min. The decline in the first part of the trace was exponential (inset). B, In the chamber-clearing trace, preclearing isoprene levels were normalized to predarkness emission levels in the emission trace. Subtracting the clearing trace from the emission trace yielded the true postillumination isoprene emission. This difference showed up as two distinct peaks at temperatures less than 45°C. DMADP (first peak) and early metabolites (second peak) were then separated and integrated in Origin (inset).

