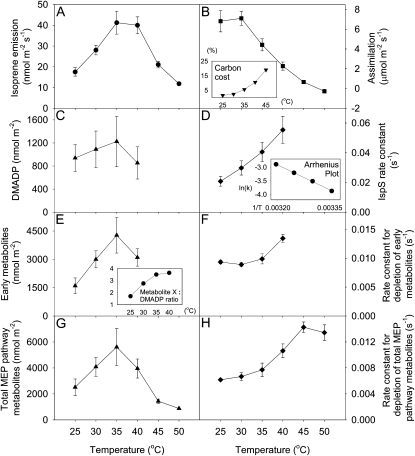
Figure 3.
Temperature dependence of isoprene emission rate (A), assimilation rate (B), DMADP (C), IspS rate constant (D), early metabolites (E), the rate constant for depletion of early metabolites (F), total MEP pathway metabolites (G), and the rate constant for depletion of total MEP pathway metabolites (H) in oak leaf. The amounts of early metabolites and total MEP pathway metabolites are in isoprene units. The carbon cost of isoprene as a percentage of assimilation at a given temperature was calculated assuming that the synthesis of each isoprene requires six fixed carbons (B, inset). The rate constant for depletion of a certain metabolite was calculated by dividing isoprene emission rate by the amount of the metabolite. An Arrhenius plot of ln(k) versus 1/temperature (K) for isoprene synthase is shown in D, inset. Early metabolites to DAMDP ratio are shown in E, inset. DMADP and early metabolite data for temperatures over 40°C could not be obtained, since it was impossible to separate the two peaks at higher temperatures. Each point denotes the mean ± se (n = 4).

