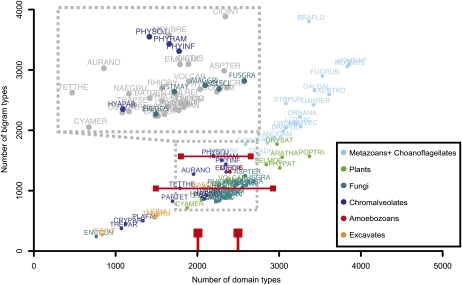
Figure 3.
Dependence of the number of domain and bigram types observed in the analyzed species. The average number of different bigrams of species that have between 2,000 and 2,500 different domain types is indicated with the bottom horizontal red bar. The top horizontal red bar indicates the average number of different bigrams for Phytophthora species. The full species names corresponding to the abbreviations can be found in Supplemental Table S1. A magnification of the area encompassing the oomycete and fungal plant pathogens is shown; the species of interest are highlighted. The dots are colored according to the major eukaryotic groups as indicated in the text box.

