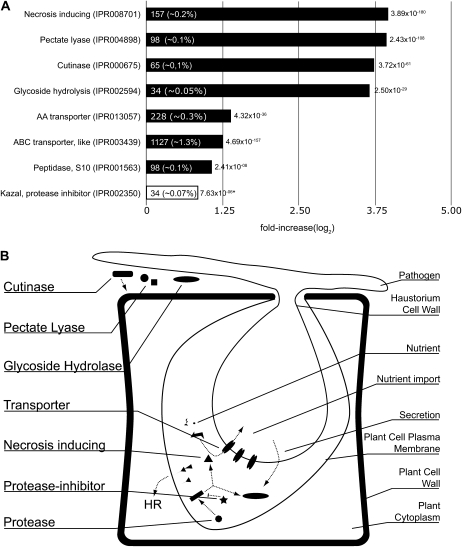
Figure 4.
Overrepresentation of selected, well-described domains involved in plant-pathogen interaction and establishing or maintaining infection. A, The log2-fold overrepresentation of the domains in plant pathogens is shown in the bar chart. The absolute number of occurrences in plant pathogens and the percentage of all predicted domains in plant pathogens are displayed in the bars, and the corrected P values are shown at the tip of the bars. The fold overrepresentation and the P value for the Kazal protease inhibitor domain were based on the overrepresentation in oomycetes compared with plant pathogens (indicated by the white bar and asterisks). B, The overrepresented domains described in A are depicted in their possible cellular role during infection of the plant host.

