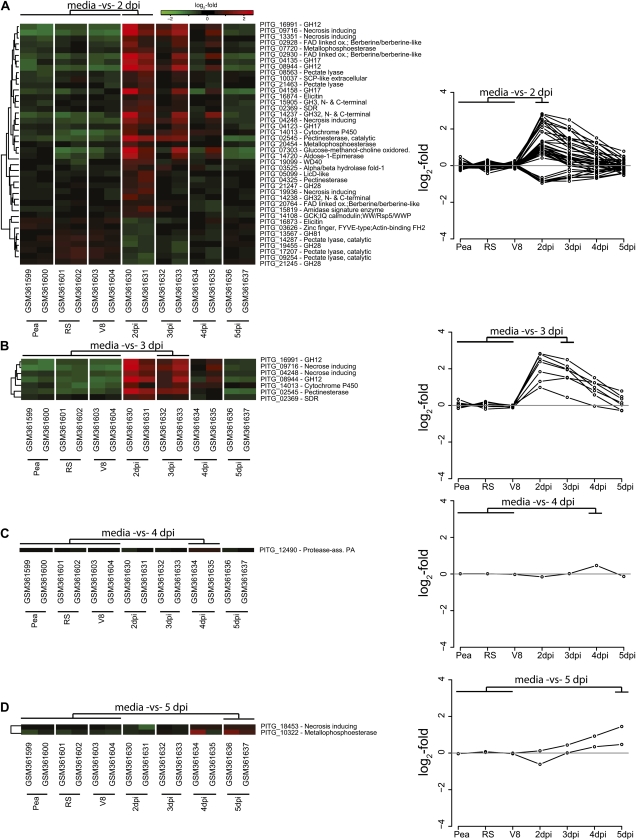
Figure 5.
Gene expression analysis of P. infestans genes encoding overrepresented domains and a predicted N-terminal signal peptide. Genes with significant gene expression changes at different time points after infection (2–5 dpi) relative to the expression intensities of different growth media are displayed (P < 0.05, q < 0.05, by t test). Heat maps show the significantly differentially expressed genes at different time points relative to growth media. Genes were clustered using Spearman rank correlation and average linkage clustering. Gene identifiers as well as domain descriptions are displayed. Gene expression profiles are displayed for the expression intensities relative to the average intensities of the growth media for each time point after infection. Heat maps and expression profiles of the significantly differentially expressed genes relative to the growth media are shown for individual time points as follows: 2 dpi (A), 3 dpi (B), 4 dpi (C), and 5 dpi (D).

