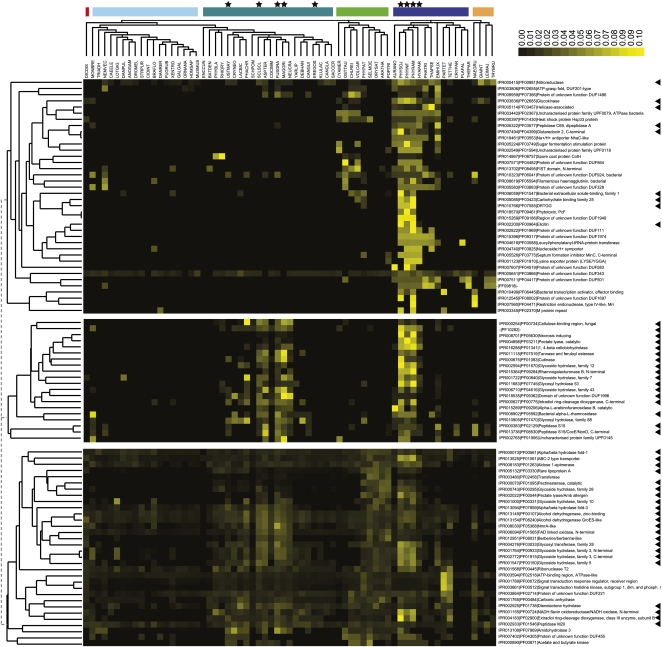
Figure 6.
Average linkage clustering of normalized domain profiles using Spearman rank correlation as a distance measurement. The species tree for all eukaryotic species is depicted on top, with the color code of their supergroup as introduced in Figure 1. Plant pathogens are marked with stars, and the arrowheads highlight domains identified as overrepresented in plant pathogens.

