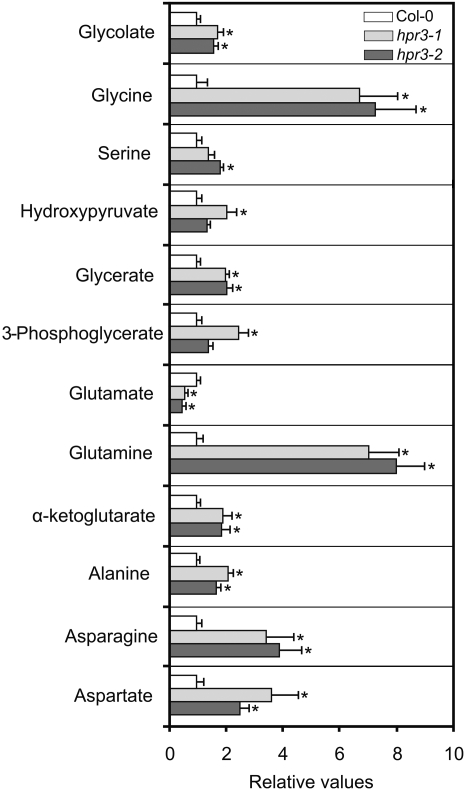
Figure 3.
Alteration of the leaf content of selected metabolites in the individual hpr3-1 and hpr3-2 knockout plants compared with the wild type (ecotype Columbia [Col-0]). Plants were grown in normal air with a 10/14-h day/night cycle. Leaves of six individual plants per line were harvested in the middle of the photoperiod at developmental stage 5.1 (Boyes et al., 2001). Mutant-to-wild-type ratios ± sd of relative mean metabolite contents are shown with the mean wild-type values arbitrarily set to 1 (wild type, white bars; hpr3-1, light gray bars; hpr3-2, dark gray bars). Asterisks show significant changes according to Student’s t test (P < 0.05).

