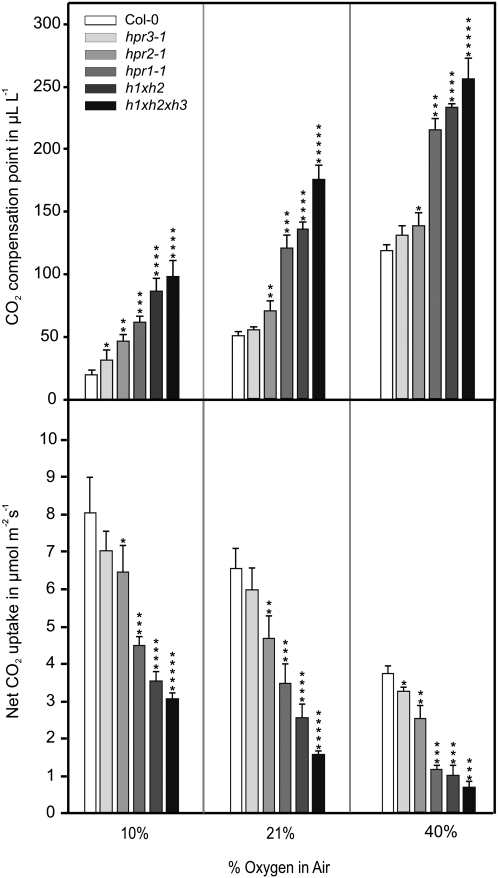
Figure 9.
Oxygen-dependent gas exchange of selected HPR mutants. Plants were grown in elevated CO2 (0.15%) with a 10/14-h day/night cycle. After reaching growth stadium 5.1 (Boyes et al., 2001), plants were transferred to ambient air and, after 1 week of adaptation, photosynthetic rates and CO2 compensation points were measured as a function of oxygen concentration (10%, 21%, and 40%). Mean values ± sd (n = 5) are shown and are listed in Supplemental Table S3. Asterisks show significant alterations according to Student’s t test (P < 0.05 for the wild type [*], hpr3-1 [**], hpr2-1 [***], hpr1-1 [****], and hpr1xhpr2 [*****]). Calculated slopes of the γ/oxygen response lines were 0.000355 ± 0.000032 μL μL−1 (wild type), 0.000507 ± 0.000028 μL μL−1 (hpr1), 0.000531 ± 0.000024 μL μL−1 (hpr1xhpr2), and 0.000561 ± 0.000018 μL μL−1 (hpr1xhpr2xhpr3).

