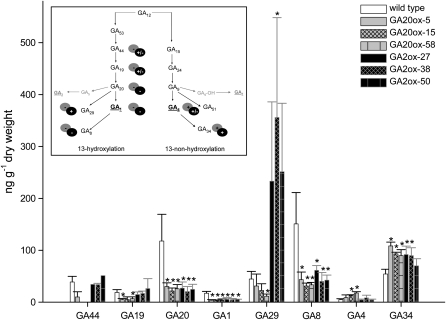
Figure 4.
Endogenous GA levels in potato wild-type and transgenic plants overexpressing either GA20ox or GA2ox. GAs were isolated from the shoot apex of growing plants (leaf nos. 1–5) and analyzed using gas chromatography-mass spectrometry. Values are shown as ng GA g−1 dry weight and represent means ± sd of three to five independent experiments. * Statistically significant differences from the wild type were determined in one-tailed t tests assuming unequal variance (P ≤ 0.05). The inset shows a schematic drawing of the changes in GA metabolism due to the expression of GA2ox (black circles) or GA20ox (gray circles) in potato plants. GA12 is the common precursor for all GAs. The 13-hydroxylation pathway leads to GA1, whereas the 13-nonhydroxylation pathway leads to GA4, as major bioactive forms. Bioactive GA species are underlined.

