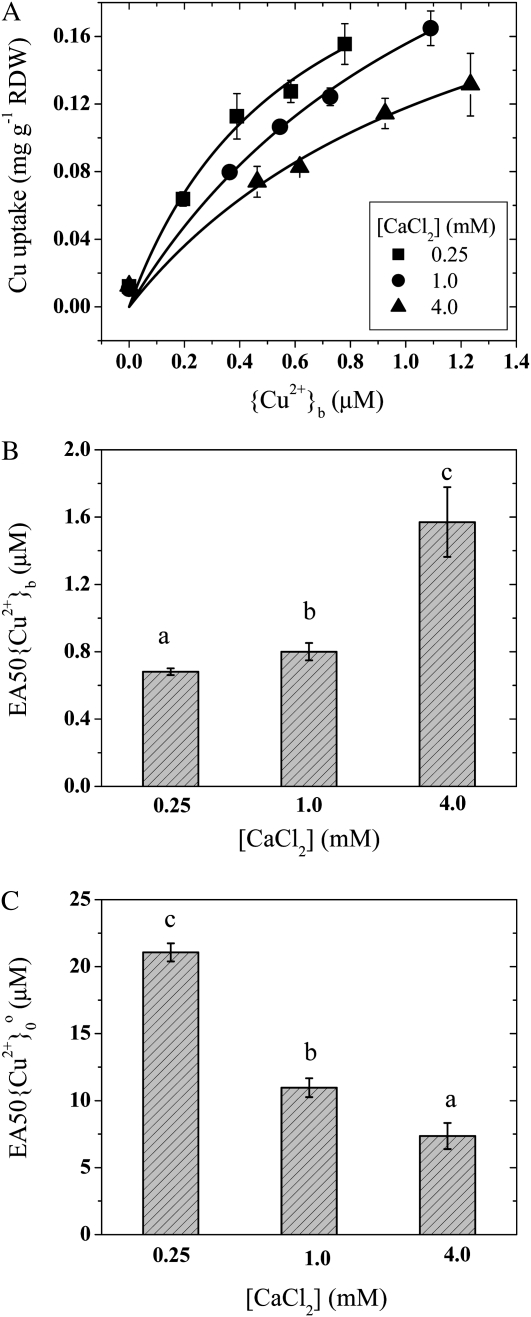
Figure 2.
Uptake and toxicity in response to Cu2+ and Ca2+ in wheat seedlings, showing the uptake of Cu2+ as a function of {Cu2+}b at different [CaCl2] (A), the effect of Ca2+ on EA50{Cu2+}b (B), and the effect of Ca2+ on EA50{Cu2+}0 (C). Error bars indicate 95% confidence intervals. Different letters indicate significant differences among means (P < 0.01). Data are from experiments 3 and 11. RDW, Root dry weight.

