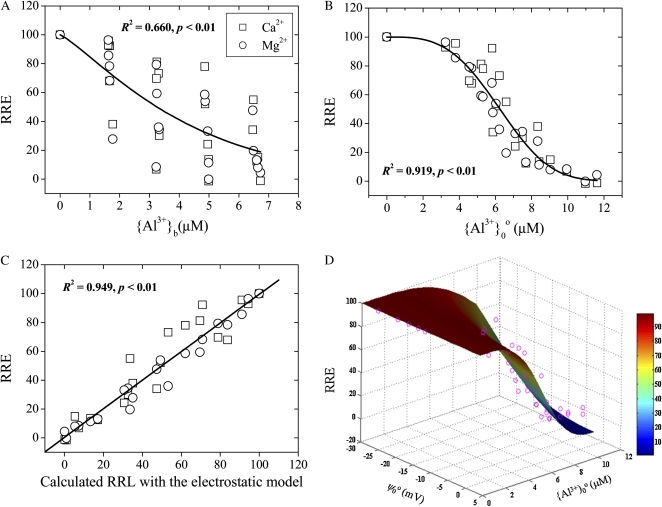
Figure 6.
Measured RRE of wheat seedlings exposed to Al3+ affected by Ca2+ and Mg2+. Data were taken from Kinraide et al. (1992; experiment 14). The RRE is plotted as functions of {Al3+}b (A), {Al3+}0o (B), or calculated Al3+ toxicity based on the ETM (C) or ψ0o and {Al3+}0o (D).

