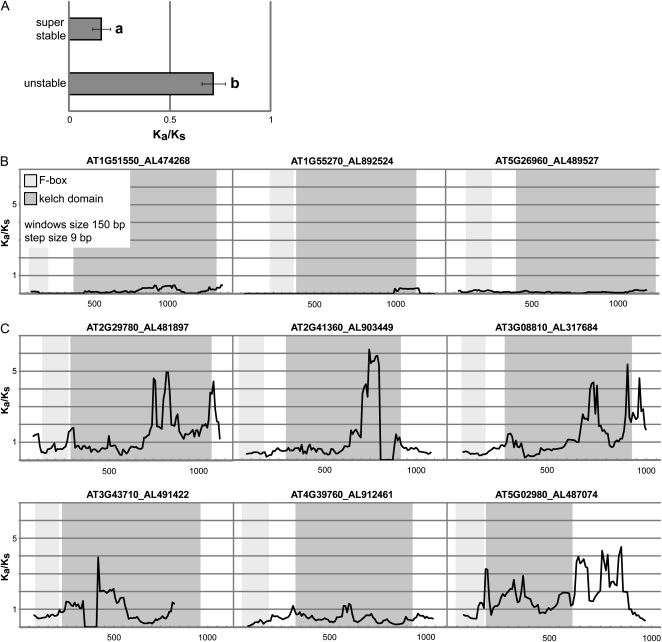
Figure 5.
Divergence levels of FBKs (A. thaliana versus A. lyrata). A, Mean Ka/Ks ratios of superstable (n = 10) and unstable (n = 37) FBKs. Only A. thaliana genes with a single A. lyrata ortholog were included (Supplemental Fig. S7). Error bars denote se. a and b denote significant differences according to Student’s t test (P < 0.0001). B, Sliding window plots of representative superstable FBKs. C, Sliding window plots of representative unstable FBKs. For sliding window analysis, nucleotide sequences of A. thaliana (indicated by Arabidopsis Genome Initiative identifier) and homologous nucleotide sequences of A. lyrata (indicated by protein identifier according to the Joint Genome Institute) were used. Window size was 150 bp, and step size was 9 bp. For A. lyrata protein 491422, only a partial coding sequence could be analyzed. Light gray boxes highlight the F-box domain, and dark gray boxes highlight the kelch domain positions.

