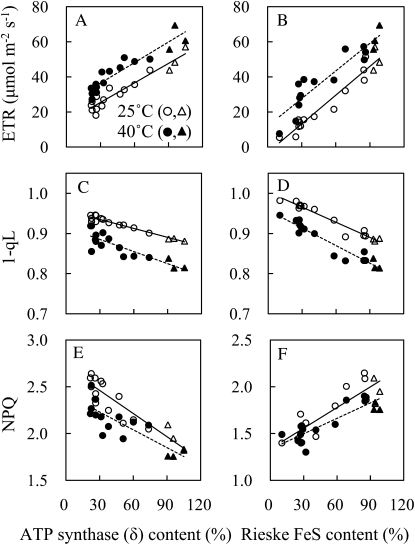
Figure 3.
Chl fluorescence parameters at 380 μL L−1 CO2 concentration at 1,200 μmol photons m−2 s−1 at 25°C (white symbols) or 40°C (black symbols) in antisense plants with a variety of contents of δ-subunit of chloroplast ATP synthase (A, C, and E), and in antisense plants with a variety of Rieske FeS contents (circles; B, D, and F). A and B, ETR. C and D, 1−qL that reflects the plastoquinone reduction state. E and F, NPQ. The data in the wild type are shown in triangles, whereas the data in antisense plants are shown in circles. The regression lines are shown in each figure. A, R2 = 0.92 at 25°C, R2 = 0.87 at 40°C. B, R2 = 0.94 at 25°C, R2 = 0.87 at 40°C. C, R2 = 0.95 at 25°C, R2 = 0.75 at 40°C. D, R2 = 0.95 at 25°C, R2 = 0.91 at 40°C. E, R2 = 0.83 at 25°C, R2 = 0.70 at 40°C. F, R2 = 0.77 at 25°C, R2 = 0.77 at 40°C.

