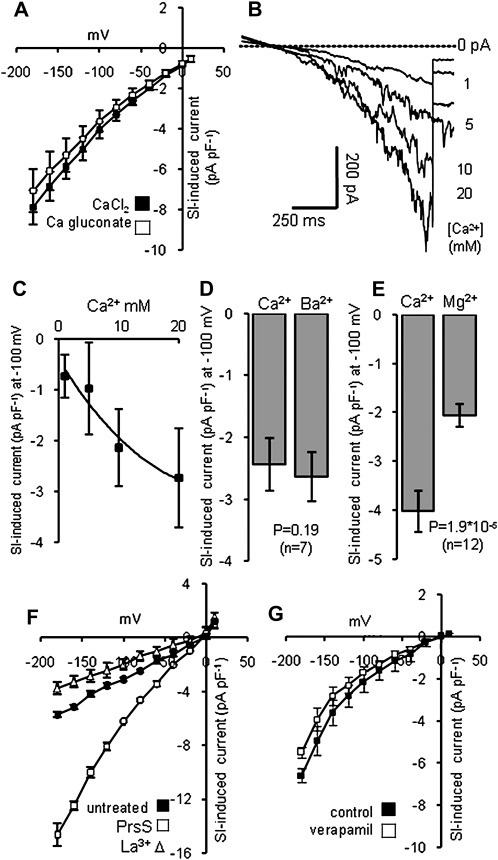
Figure 4.
Characteristics of the SI-stimulated Ca2+-permeable conductance. SI was induced by the addition of PrsS3 + PrsS8 to pollen protoplasts (haplotype S3 or S8), bathed in Ca2+-containing saline. Currents were elicited using the voltage ramp protocol. A, Mean SI-induced current (n = 4) measured in saline containing 10 mm CaCl2 (black squares), then in saline where CaCl2 was replaced with calcium gluconate (white squares). B, A representative set of raw traces for whole cell current recorded from the same protoplast at different Ca2+ concentrations. C, Mean data for the effect of different Ca2+ concentrations on SI-induced currents (n = 3). D, The mean SI-induced current at −100 mV in Ca2+-containing medium (Ca2+) and in medium where CaCl2 was replaced by BaCl2 (Ba2+; n = 7). E, The mean SI-induced current (n = 12) at −100 mV in Ca2+-containing medium (Ca2+) and in medium where CaCl2 was replaced by MgCl2 (Mg2+). F, SI-induced currents recorded at −100 mV, in standard Ca2+-containing medium (untreated control; black squares), after addition of incompatible PrsS (white squares) and after subsequent addition of 500 μm La3+ (white triangles). The current induced by incompatible PrsS was completely abolished (n = 3). G, SI-stimulated currents recorded at −100 mV were tested for sensitivity to verapamil. The I-V curves (n = 3) are shown after addition of incompatible PrsS, first in standard Ca2+-containing medium (black squares) and then after addition of 50 μm verapamil (white squares). All data are means ± se.

