
Figure 2. Methodology for determination of the incidence of protein expression on actin bridges.
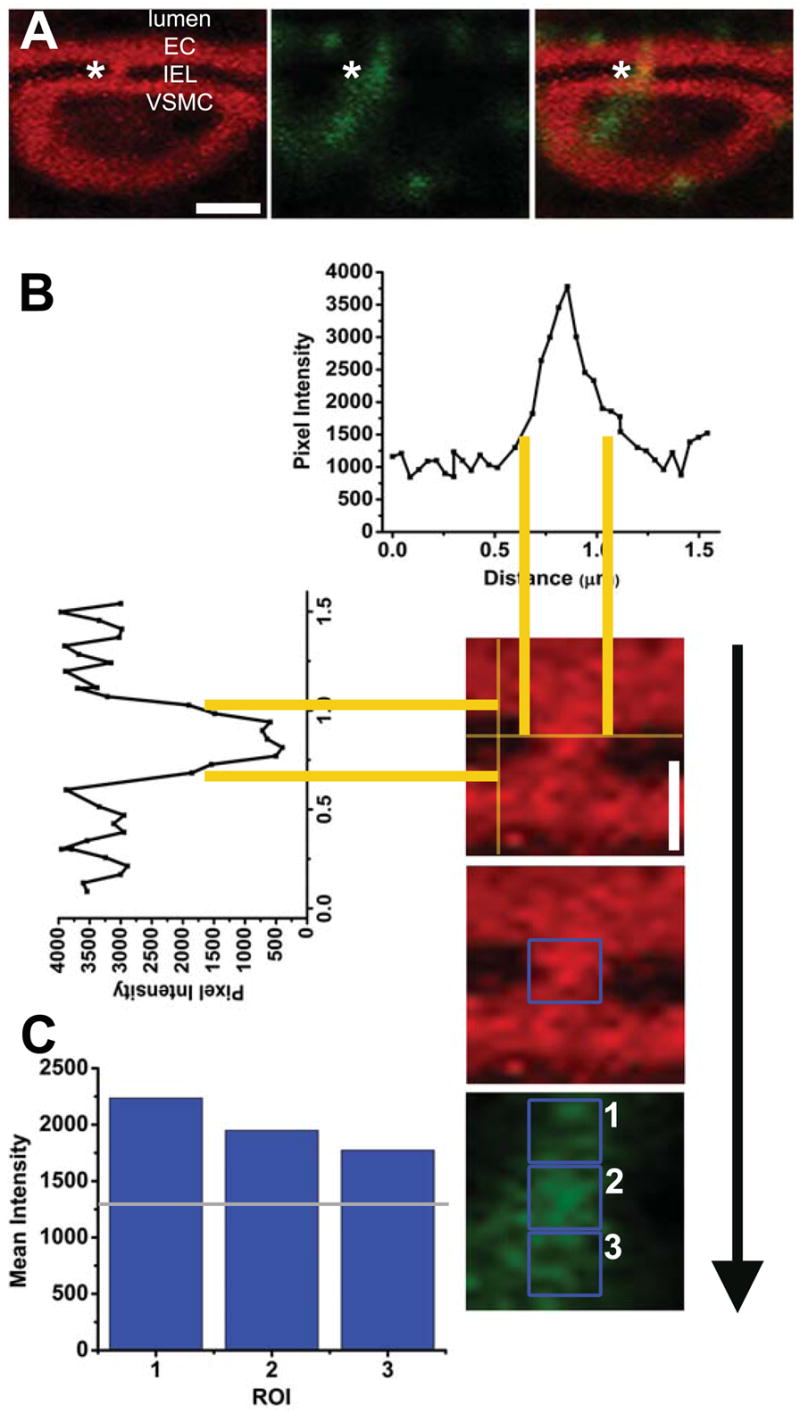
A, arteriole double stained with phalloidin (red) and Cx43 (green); asterisks indicating the actin bridge between VSMC and EC. In B, representative intensity plots running horizontal and vertical defined the IEL and approximate localization of an actin bridge indicated by asterisk in A. Yellow lines are guides for localization of intensity on the histograms. The intersections of the new vertical and horizontal intensity lines formed a box unique to each actin bridge. Due to irregular MEJ shapes and sizes, these intensity lines were moved 5% outward to encompass as much area as possible; this formed a ROI over the actin bridge (blue box). In C, blue boxes demonstrate the ROI for EC (1), the actin bridge (2), and VSMC (3). The mean pixel intensity from each of these boxes is in histogram format in C. The grey line is 25% below the value in ROI 3 and used as a bench mark for pixel intensity in ROI 2. In this incidence, the protein is found on the actin bridge. See Materials and Methods for details. White bar in A is 3 μm and is representative for all other images in A; in B, white bar is 1 μm and is representative for all other images in B and C.